
If you’ve read any of my prior articles, chances are that you’ve seen me mention xwOBA (expected weighted on-base average) several times. It is my favorite baseball statistic, especially for hitters, and I feel as though it is the best publicly-available way to quantify batted ball luck over large samples. Given the frequency of my references to xwOBA, I figured a standalone article explaining what it is and why I use it so often might be helpful as a reference for the future.
If you’re already familiar with Statcast lexicon, feel free to skip to the “Why xwOBA is useful” section.
Beginning with the basics: Statcast (Baseball Savant) statistics
According to MLB.com, Statcast is “a state-of-the-art tracking technology that allows for the collection and analysis of a massive amount of baseball data.” Baseball Savant is a website that allows the public to access many Statcast-based metrics. For example, the below image is a common application of the website.
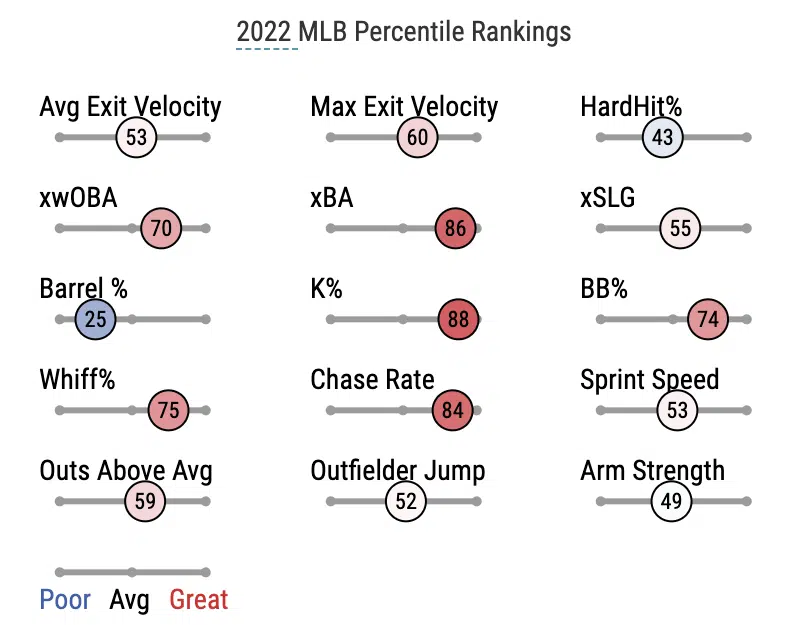
This is a screenshot of Andrew Benintendi’s Baseball Savant profile. Many of the statistics in these percentile rankings are self-explanatory, and some are more popular than others. You also might notice that xwOBA is included. While I enjoy the percentile-based system that Baseball Savant tends to use, I do sometimes get annoyed that these screenshots circulate throughout social media solely to support a narrative about a player even when the statistics in the image contrast with the narrative in question.
For example, xwOBA is the most important statistic in this image to evaluate a player’s overall expected contribution on offense. But regularly, I will see a player with a 75th percentile xwOBA (or better) maligned on Twitter because one of the supplementary statistics (such as average exit velocity or strikeout percentage) are below average. While every statistic on this page is important, the offense-based stats here exist as smaller pieces of the larger puzzle that is xwOBA (I’ll expand on this in the next sections).
However, it is worth noting the value of these statistics. For example, exit velocity is a reference to how hard a batter hits the ball, while hard-hit rate shows the percentage of batted balls (in fair territory) that a batter hits above 95 MPH. As you might expect, xBA and xSLG are simply expected batting average and expected slugging percentage, which are derived from each player’s individual batted ball data (exit velocity, launch angle) as well as their sprint speeds on certain batted balls. They represent one way to attempt to take luck out of a hitter’s statistics (e.g., a player with a .300 batting average but .240 xBA might be having a particularly lucky season).
Barrel rate refers to the percentage of batted balls that are “barreled,” or contain the perfect combination of exit velocity and launch angle (a barrel has a minimum xBA of .500 and xSLG of 1.500). Of course, the above image only shows percentile rankings, not raw totals (meaning Benintendi’s hard-hit rate is not 43%, but rather in the 43rd percentile. His 2022 hard-hit rate was actually 38.7%).
We can use these figures on a granular basis to show different types of results. Below is an example of a hit for which batted ball luck cannot reasonably be argued as a primary contributor to the result.
Above, Eloy Jimenez hits a ball at 110.7 MPH with a 26-degree launch angle, sending it 428 feet. This batted ball had an xBA of .991, meaning that historically, batted balls hit this hard and at this angle become hits over 99% of the time. Below is an example where xBA can be used to support an argument for a batter being unlucky.
Here, Yoan Moncada hits a ball at 106.5 MPH with a 31-degree launch angle, sending it 407 feet. Despite its xBA of .957, this only looks like a regular flyout in a box score. Of course, even the old-fashioned eye test would support the idea that Moncada was unlucky here, but Statcast allows us to quantify how unlucky he was. Moreover, it is useful for other cases, such as below.
In this case, Adam Engel hits a ball at 92.9 MPH with a 39-degree launch angle, sending it 252 feet to left-center field. However, thanks to his hustle and a defensive miscommunication, this becomes a double. The xBA on this batted ball was only .037, meaning that it becomes an out over 96% of the time it is hit. Even if the hit appeared lucky to the naked eye, it is helpful to be able to quantify luck to some degree.
Eventually, if you track xBA enough on a game-by-game basis, you even become able to gather what an xBA of a batted ball is before the Baseball Savant website refreshes. For example, at White Sox games as of 2022, the scoreboard displays exit velocity, launch angle, and projected distance instantaneously. With enough exposure to what combinations of xBA and launch angle lead to what ranges of xBAs, you can tell what an xBA is on your own to a fairly high degree of accuracy.
These individual events all have an associated xBA, xSLG, etc., and they all add up to give players cumulative expected stats. As for using xBA and xSLG to assess luck, it is important to note two things. First, minor discrepancies between expected and actual statistics are normal. If a player has a .285 batting average and .288 xBA, it would be foolish to act as if the player has been very unlucky. Moreover, when comparing expected and actual stats, it is also crucial to take note of outliers over large (approaching/exceeding 1,000 plate appearance) samples.
Tim Anderson, for example, has a .290 xBA since the beginning of the 2019 season, but his actual batting average since then is .318. A .290 xBA is quite high and supports the idea that Anderson is a talented hitter, but the .028 difference between his actual and expected average would not be a good way of arguing that Anderson is “lucky” since we are discussing a four-year stretch that covers 1,641 plate appearances. Over that large of a sample, Anderson’s results being better than his (still high) expected numbers point to a flaw in the expected numbers themselves (to be covered in the “how xwOBA can be improved” section).
What is wOBA?
In order to understand xwOBA, basic Statcast literacy is not the only prerequisite. It is also necessary to have some familiarity with wOBA (weighted on-base average). Thankfully, wOBA is not a completely foreign concept if the above sections make sense because it is actually just an extension of more traditional statistics. Instead of emerging from Statcast metrics (which, spoiler alert, is how we get xwOBA), wOBA is an all-encompassing offensive metric that measures actual results rather than expected performance.
For me, it is easiest to think of wOBA as a stat that is similar to wRC+, which is another popular statistic that measures all-around production on offense. wOBA, however, is measured on a scale similar to OBP (on-base percentage), so an average wOBA in recent years ranges from .310-to-.325. The full formula can be found on Fangraphs, but the best argument for it may be the following excerpt:
Weighted On-Base Average combines all the different aspects of hitting into one metric, weighting each of them in proportion to their actual run value. While batting average, on-base percentage, and slugging percentage fall short in accuracy and scope, wOBA measures and captures offensive value more accurately and comprehensively.
Source: Fangraphs
wOBA is a more holistic stat than batting average, on-base percentage, or slugging percentage since it takes all three into account and adjusts for annual league trends. OPS is another stat that attempts to consider both on-base skills and power production, but unlike wOBA or wRC+, OPS assumes that one point of OBP is equal to one point of SLG, which is very much untrue and skews too heavily toward high-SLG, low-OBP types.
In addition, OPS is simply just the sum of a player’s on-base percentage and slugging percentage, which makes mathematicians cringe (for example, the two formulas don’t have common denominators). As a result, wOBA and wRC+ tend to be considered the best and simplest statistics for evaluating holistic offensive performance.
However, while wOBA is a great tool, it only measures actual on-field results. It cannot offer many insights as to whether a player has been particularly lucky unless it is just being used as a comparison. And hence, we get to xwOBA.
What is xwOBA?
According to Baseball Savant, xwOBA is “formulated using exit velocity, launch angle and, on certain types of batted balls, Sprint Speed.” If you’re interested in more specific information regarding the formula, you can find it here.
The beauty of xwOBA is that if you understand wOBA — the scale, the holistic nature, and the limitations — then you do not need to know much more. In simple terms, xwOBA is just wOBA, but instead of measuring on-field results, it uses batted ball data from Statcast as the input.
To use a specific example, the Yoan Moncada deep flyout shown earlier was, of course, an out, and therefore a .000 wOBA. However, based on the high exit velocity and probability of a hit (including a 3.837 xSLG, which essentially means that it was extremely likely to be a home run), the batted ball had a 1.930 xwOBA. By using xwOBA instead of wOBA in this case, Moncada is not being penalized by factors outside of his control. He gets credit for his process being sound despite the negative result, and the idea is that in the long run, should he continue hitting the occasional 407-foot fly ball, Moncada’s results would improve.
As for the opposite scenario, we can revisit Adam Engel’s hustle double from earlier. In the box score, the double might as well have been a 110 MPH screamer off the wall, and the wOBA for his double was around 1.240. However, based on the batted ball data, the xwOBA for this event was only .034. Here, Engel gets penalized for the routine fly ball even though it ended up as a double. Again, this is because baseball is a long-run sport by nature, and in the long run, if Engel were to continue making that kind of contact, he would be out far more often than not.
xwOBA is far from perfect, and its flaws will be outlined in a later section. But to reiterate, it is essentially just another form of wOBA that uses granular batted ball data instead of results. In even simpler terms, it is a tool for evaluating what “should” have happened had a player’s season neither lucky nor unlucky, but rather exactly in line with what Statcast would expect based on his exit velocities, launch angles, and sprint speed (in some cases). And of course, it is always on the same scale as OBP.
In a single-game sample, wOBA might be more useful than xwOBA since it measures what actually happened. However, in the long run, xwOBA is arguably more useful since it portrays what should have happened on each batted ball throughout the course of a season. I would hesitate to put the “predictive” label on it, however, for reasons that will be outlined later.
Finally, while this article is focused on offense, both xwOBA and wOBA exist for pitchers as well. The calculations and philosophy behind using them are the same: since we can now quantify every batted ball, pitchers, too, can be evaluated based on what “should” have happened. It is worth mentioning, though, that hitters face different defenses throughout a season, whereas pitchers typically pitch in front of the same defenders for an entire year. Considering that Statcast’s expected stats are based on league-wide outcomes rather than team-specific events, this can either help or hurt pitchers significantly, depending on the quality of their defense.
What is xwOBACON?
Note: this section is not necessary to understand anything that comes up later, so if it is confusing or something that you do not care to know about, then feel free to skip.
xwOBACON is another Statcast metric that is derived from xwOBA. Occasionally cited in jest due to the “-BACON” aspect of the name, it is actually somewhat useful and not very difficult to understand, given a baseline understanding of Statcast metrics.
The “CON” in xwOBACON refers to contact. Thus, xwOBACON is a player’s xwOBA when he makes contact (excluding foul balls, unless they result in an out). One might choose to look at xwOBACON instead of xwOBA when factors such as walks or strikeouts are irrelevant, and the sole research purpose is to understand how much damage a player should have done when he made contact.
Since xwOBACON eliminates strikeouts completely by only focusing on batted balls, it will usually be lower for contact-heavy hitters such as Andrew Benintendi (.351 xwOBACON in 2022; league average xwOBACON is .368). Of course, this means it tends to favor powerful, high-strikeout hitters like Joey Gallo (.427 xwOBACON in 2022, .521 career xwOBACON). Therefore, its uses should be confined to specific comparisons rather than more generic applications, because strikeouts and walks are obviously very important.
Why xwOBA is useful
Beyond the established value of using xwOBA as a comparison between players or against a player’s own wOBA, it has further strengths.
Granularity
Most notably, xwOBA’s granularity sets it apart from much of its competing (public) stats. Both advanced stats like wOBA and future projection algorithms often rely solely on results or past trends when evaluating hitters, but xwOBA uses each individual batted ball and weights them equally. Such specific data has historically only been available to teams, many of which use proprietary statistics and algorithms.
A BABIP alternative
Beyond the granularity, xwOBA offers the public a reliable metric that can be used to gauge batted ball luck beyond cursory BABIP-based analysis. BABIP, or batting average on balls in play, indicates what a player’s batting average is on balls that he hits into play (excluding home runs). When a player has a .400 BABIP, for example, it is likely that he is having a lucky season and may be due for regression.
The problem with BABIP, however, is that it completely eliminates batter-specific contact quality from the equation. Tim Anderson, for instance, routinely posts high BABIPs that would otherwise be considered unsustainable. While this has not stopped some segments of the baseball stats world from lazily arriving at “Tim Anderson is due for regression, just look at his BABIPs!” conclusions, it still can help prove that BABIP alone is insufficient at determining batted ball luck.
(Fun fact: through a fairly straightforward Baseball Savant search, you can actually go beyond xBA to find a player’s xBABIP. I still think xwOBA is more useful, but feel free to reach out if you’re interested in the formula or applications.)
The lack of false or aspirational claims
Finally, I appreciate that xwOBA does not claim to be anything that it is not. It is an evaluation tool that is most useful when checked against wOBA over the same timeframe/player(s). While it can certainly be more predictive than wOBA, it is difficult to make any definitive claims for two reasons.
The first, and perhaps easiest, is that the wOBA and xwOBA formulas change both due to constants (which can reflect league-wide trends) and, from a Statcast perspective, the constant influx of new data. By this, I mean that a ball hit at, say, 93.4 MPH with an 18.1-degree launch angle has a defined xBA, xSLG, xwOBA, and so on. But if dozens of baseballs are hit at that velocity and angle throughout the 2023 season, and suddenly far fewer of them result in hits than before, then the underlying data changes (i.e., the defined xBA might become a few points lower). Given the new nature of the statistic and Statcast as a whole, this is an understandable impediment.
Moreover, it is also difficult to claim predictive value because doing so may implicitly assume that a player’s batted ball results remain somewhat constant over large (e.g., multi-year) samples. On the contrary, it is quite normal for a player’s batted ball metrics to change, in the sense that a hitter might adjust his swing plane and see a significant change in launch angle, or perhaps that an aging hitter might gradually see a decrease in average exit velocity.
Instead of framing xwOBA as predictive over large samples for particular hitters, it might make more sense to view it as predictive for specific batted balls. In other words, it makes sense to assume that if a player maintains a similar contact profile over time, xwOBA would be more predictive than wOBA. However, it does not always make sense to assume that a player maintains a similar contact profile, because this is how players get better or worse (beyond short-lived, luck-driven streaks).
While xwOBA is not best deployed as a projection tool due to the above factors, it is highly accurate at what it sets out to do. Even with the prospect of new Statcast data, an X MPH batted ball hit at a Y-degree launch angle will still result in a particular outcome more often than not, and only Statcast is capable of providing these figures and outcomes at such granular levels.
How xwOBA can be improved
Despite its use cases and accuracy, xwOBA still has shortcomings that can feasibly be addressed in the coming years based on data that already exists.
Spray angle
xwOBA — and all Statcast statistics, really — use exit velocity, launch angle, and in some cases, sprint speed to determine the expected values of a batted ball. Spray angle, however, is not considered, and it probably should be. It may, in fact, be the reason that Tim Anderson’s expected statistics, while good, never quite capture his actual results.
Spray angle is the “other” angle of a batted ball that is explored in the mainstream, but not as precisely as launch angle. We most commonly see spray angle considered in the context of spray charts or pull/push rates. While launch angle refers to the y-axis of a batted ball, spray angle pertains to the x-axis.
Much like launch angle is just a simple way of expressing concepts that have existed in baseball for decades, spray angle is another way of discussing batters who hit the ball to the pull side, up the middle, or to the opposite field. The main distinction is that spray angle allows us to look past the three classifications from the prior sentence in favor of a more specific figure.
For example, modern hitting coaches understand the value of pulling the ball in the air. A right-handed hitter can make good but not great contact to left field, and still hit a home run. That same hitter can barrel a baseball at 100+ MPH to right-center field but have a routine flyout. This is because it is easier to access power to the pull side, even on weaker contact. It also is obviously easier to hit a home run off a foul pole that is 335 feet away as opposed to a right-center field gap that is 375 feet away.
A problem with xwOBA, then, is that it does not consider spray angle, so players that emphasize pulling the ball in the air (such as Marcus Semien) might appear lucky by an xwOBA/wOBA comparison when that is not truly the case. On the other hand, a player that hits for power but has more of an opposite-field approach might be more likely to underperform compared to his xwOBA because his best contact is occurring toward areas of the field where it is hardest to collect extra-base hits.
In the above video, Yasmani Grandal hits a ball at 95.2 MPH at a 39-degree launch angle. It only traveled 345 feet (which might be wind-aided), but because he pulled it down the left-field line, it was a home run. A 345-foot flyball to almost any other part of the ballpark would have been a routine flyout.
Since xwOBA does not account for spray angle, this batted ball had only a .057 xBA and .090 xwOBA. While these figures do accurately reflect that Grandal hit the ball too high in the air to be a hit in most circumstances, they would likely be higher if spray angle were taken into account.
In this example, Eloy Jimenez barrels a ball at 103.7 MPH and a 28-degree launch angle (this combination basically screams “home run”), but this 372-foot blast was hit to right field and was caught at the warning track. Since the pitch was a hittable sinker on the outside part of the plate, Jimenez should absolutely not have been trying to pull it down the left-field line. Nevertheless, his exceptional contact still resulted in an out.
Jimenez’s batted ball had an .814 xBA and 1.639 xwOBA, but again, had spray angle been a consideration, these figures would likely have been lower. It is still important to note how solid this contact was, but the fact that it was hit to the right-center field gap certainly limited its potential. xwOBA does not account for this, but as stated, it probably should.
Circling back to the Tim Anderson example, one theory as to why his actual numbers outpace his (still high) expected statistics is that Anderson regularly uses his fast hands at the plate to intentionally spray the ball to the opposite field. This limits his power production, but greatly increases his ability to collect base hits.
Anderson, who hit toward the opposite field 30% of the time in 2022 (against a 25% league average), is one of the few hitters in baseball who is talented enough to still try to hit the ball through defensive gaps on a regular basis despite the league-wide increases in pitch velocity and movement. In the above video, he swings relatively late on a 97 MPH fastball and still guides it through the hole on the right side of the infield. Since expected stats such as xwOBA do not account for spray angle, perhaps this is why he routinely outperforms Statcast’s high but ultimately conservative expectations.
Static walks/strikeouts
This might be more of an ambitious request, but one thing that has always bothered me about xwOBA is the chasm between batted ball events and plate appearances that result in a walk, strikeout, or hit by pitch. As mentioned, a major strength of the statistic is that each batted ball results in a very specific figure (i.e., there are thousands of potential xwOBA figures for each plate appearance, rather than an outcome of either 0 or 1 exactly).
However, a walk or strikeout are completely binary like in other statistics. By this, I mean that a walk or a strikeout will produce similar values every time they occur toward the cumulative, season-long xwOBA calculation, whereas a flyout could result in almost 0.001 xwOBA or even 1.905 depending on its exit velocity and launch angle.
There are two takeaways that relate to the binary walk and strikeout problem. First is the (ideally temporary, pending an automated strike zone) problem of bad umpiring. The whole point of xwOBA, after all, is to demonstrate what “should” have happened with normal luck. Therefore, penalizing players for being called out on strikes on a pitch out of the strike zone — or rewarding hitters for drawing a walk on a pitch in the strike zone — seems to fly in the face of xwOBA’s value proposition.
I am not advocating for manual intervention, of course. xwOBA is an algorithm and is objective by nature. However, Statcast’s strike zone is well-regarded and used in a variety of analyses, so it should theoretically be possible to “overturn” a strikeout or walk on a full count for xwOBA purposes if the umpire missed the call.
This, unfortunately, creates a slippery slope and is part of what I meant when I referred to this request as ambitious. If a hitter gets called out on strikes on a bad call, but the count was 1-2, does xwOBA just erase the strikeout and pretend the plate appearance never happened? This is why I specified a full count in the prior paragraph. If the idea were implemented on full counts only, thus creating some sort of “xWalks” or “xStrikeouts” supplementary statistic, a lot of people would then be understandably confused since bad calls on most counts would not be considered.
The second takeaway, which is also a further extension of the ambitious nature of these ideas, is a potential workaround to the above problem. Instead of determining an “expected” walk or strikeout based on actual outcomes, perhaps an algorithm could be created to predict a hitter’s walk and strikeout rates based on his chase rate, contact rate, and overall swing decisions.
This would be difficult (although I’m sure several teams have found a way to track/predict this), but would be an interesting way to make xwOBA more dynamic, albeit at the expense of several other facets (e.g., how do you introduce these expected rates and remove actual walks and strikeouts while maintaining the ratio of batted ball events to other plate appearances? If a player walks or strikes out 34% of the time, but the expected walk and expected strikeout rates add up to 31%, how do you account for the change in plate appearances?).
A rudimentary way to do this would be to look into pitches per plate appearance numbers, combine that with swing decision data, and run regressions to predict a hitter’s walk and strikeout rates. However, much like penalizing players for an erroneous strike three call seems counter to xwOBA’s purpose, creating supplementary algorithms that alter a player’s actual amount of plate appearances also may be antithetical. Perhaps these walk and strikeout rate ideas are better served as a starting point for a new, xwOBA-adjacent statistic, rather than an extension of the current version.
Clearer messaging (especially on player profiles)
The final, and likely easiest, suggestion to improve xwOBA relates to the way it is communicated throughout the Baseball Savant website. In the past, player profiles on the website did not include percentile sliders for statistics such as walk rate, strikeout rate, and defensive stats such as outs above average (which was unveiled by Statcast as a new statistic itself in 2020). Therefore, xwOBA was properly highlighted as the most important figure present, and it was more clear that other components such as exit velocity and sprint speed were smaller factors in the broader calculation.
Now, there is much more information on players’ profiles. While this is a positive — the more digestible information, the better — xwOBA now becomes lost in some of the shuffle from conversations that I witness, even though it is objectively the only offensive statistic present that is a culmination of several listed figures.
I would not advocate for the percentile sliders or information to be removed from Baseball Savant, but I do think the public would benefit from a greater focus on statistics that are proprietary to Statcast or more relevant to other statistics (e.g., maximum exit velocity, which is currently displayed, is an interesting tool to view a player’s full power potential, but it only pertains to one batted ball and is much less important than average exit velocity).
One idea would be to keep average exit velocity, hard-hit rate, xwOBA, xBA, xSLG, barrel rate, sprint speed, and the defensive statistics that are currently listed. Instead of removing less important figures like maximum exit velocity or non-Statcast specific stats such as strikeout rate and walk rate, perhaps the addition of a clickable dropdown menu below the more relevant numbers would implore visitors to consider xwOBA and the like more closely than they do now.
Either way, I believe that the introduction of non-Statcast metrics as well as less relevant figures to player profiles have combined to dilute the importance of existing statistics to the typical viewer. Beyond tweaks to the algorithm itself, it would be helpful if the Baseball Savant website more prominently displayed xwOBA, arguably its premier statistic, so that baseball fans become more aware of its importance.
If you’ve made it this far, I appreciate your patience! This was a lot, but I reference xwOBA in so much of my writing. I felt it made sense to write a long, fully-formed analysis of the statistic and why I like it so that I don’t have to keep justifying its inclusion in future articles with short summaries that, while simpler, do not give the subject the nuance it requires.
Please feel free to comment if there’s anything that is unclear, or if there’s something you think I missed/overlooked (another thing I love about these statistics is that there’s so much room for disagreement and new ideas). I really enjoyed writing this, and I hope you’re able to take something valuable away from it.
Be sure to follow us on social media @SoxOn35th for more!
Featured Photo: © Kamil Krzaczynski-USA TODAY Sports