
Yoan Moncada continues to be one of the hottest topic of debates in baseball analytics currently. After a dismal 2018 campaign, Moncada played up to expectations for a former #1 overall prospect in 2019, hitting .315/.367/.548 with 25 home runs, leading to a 141 wRC+ and overall 5.7 fWAR season. It was an incredible jump in production, and vaulted Moncada into the spotlight on the South Side.
Naturally, the question has become: “Can he do it again?” Most Sox fans will tell you that Moncada can repeat – and even improve upon – his 2019 campaign. Others in the baseball community – especially amongst the analytics circles – have raised skepticism about how good Moncada actually is. Until we get a 2020 season, the debate will likely continue.
Take it from someone who loves data: it’s incredibly easy to manipulate to fit your particular story. But, I think it’s time we hear from someone who watches this team daily: how good was Yoan Moncada in 2019, and just how repeatable is his performance? These are the questions I dive into with the article, while checking my White Sox Bias at the door.
A clear warning to everyone moving forward: there’s A LOT of stats and data in this. I’ve tried to write this in a way that everyone can understand, but if there are questions, tell me in the comments! But for now, let’s get into this.
What Changed from 2018
Simply put, Moncada overhauled his approach at the plate in 2019. He swung more often (47.3% from 41.1%) without swinging and missing more often (31.1% both years). He also barreled up a greater percentage of his pitches (12.2% from 9.6%), meaning he was hitting balls on the “sweet spot” much more often. So, to simplify, not only did Yoan Moncada swing at more pitches last season, he also improved the quality of contact.
Let’s take a look at what changed once the ball left the bat for Moncada from season to season. Here is the percentage of pitches Moncada hit in the air, on the ground, and as line drives from 2018 to 2019, as well as his 2019 slash line in each category.
Fly Balls: Down from 26.9% to 22.7%; .430/.430/1.392
Line Drives: Up from 28.3% to 30.7%; .640/.640/.982
Ground Balls: Up from 38.2% to 41.8%; .373/.373/.407
More line drives is a good thing. Less fly balls can be good or bad, depending on what kind of fly balls you’ve stopped hitting (“Cans of corn” versus long homers). However, the number that should jump out to you most is Moncada’s batting average on ground balls. This .373 average led the league in 2019. For reference, here are the top 10 hitters in terms of batting average on ground balls in 2019:

Moncada led the league by a pretty wide margin (hi Yolmer). This of course naturally leads into one of everyone’s favorite metrics. In 2019, Yoan Moncada led the league in BABIP (Batting Average on Balls in Play). His .406 BABIP was the highest single season BABIP in over 40 years (Rod Carew had a .408 BABIP in 1977). This means that 40% of the balls Moncada hit in the field of play (meaning, all balls except home runs) went for hits. If you think about it, you might say, “That seems incredibly high.” In reality it is, and that poses a problem – high BABIPs, in general, are associated with good luck. Hence, by studying Moncada’s batted ball statistics, we have arrived at the answer as to why so many believe Yoan Moncada’s 2019 season was an aberration: a .406 BABIP is unsustainable, and when more balls don’t fall for hits next year, Moncada’s overall level of production will decrease.
It’s a compelling argument, considering even Rod Carew’s BABIP fell back to .364 in 1978. However, explaining away a player’s success using just one statistic seems a little short-sighted. So, let’s dive into some of Moncada’s other numbers from the 2019 season, and see if we can’t take a look at what made up Moncada’s high BABIP.
Exit Velocity and Batting Average
Let’s start with one of the most common arguments in favor of Moncada’s sustainability in performance: he hits the ball hard. It’s a good argument: Moncada was in the 97th percentile for average exit velocity and 92nd percentile for hard hit percentage. It’s no secret that hitting the ball hard is a very good thing. However, how much does it help a player to hit the ball hard on the ground? Is there a statistical correlation between average ground ball exit velocity and an increase in batting average?
Unfortunately, no. In fact, there is no statistical correlation between a player’s average ground ball exit velocity and an increase in any advanced metrics either, as many others have already pointed out.
But what if we looked at a player’s expected statistics? There, naturally, we do have some correlation, considering expected statistics are largely based off of a ball’s exit velocity and launch angle.
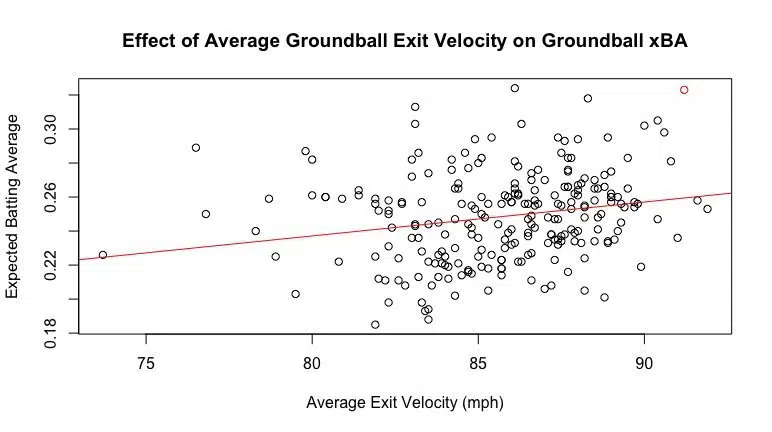
In fact, these numbers are similar for xwOBA as well – for every mile per hour a player adds on their average exit velocity on ground balls, their expected batting average and expected wOBA should increase by about two points. So, for Moncada, whose average exit velocity on ground balls was about 7 mph than league average (which was 85 mph), his expected batting average would be about 14 points higher than a league average hitter, simply due to how hard he hits the ball.
The only problem: see that red dot in the top right corner? That’s Yoan Moncada. What that means is he over performed even his expected statistics in 2019, based solely on average exit velocity, of course. However, we will get to this in a little bit. The thing you should take away from this so far is that even when hitting ground balls, hitting the ball harder leads to a higher expected batting average.
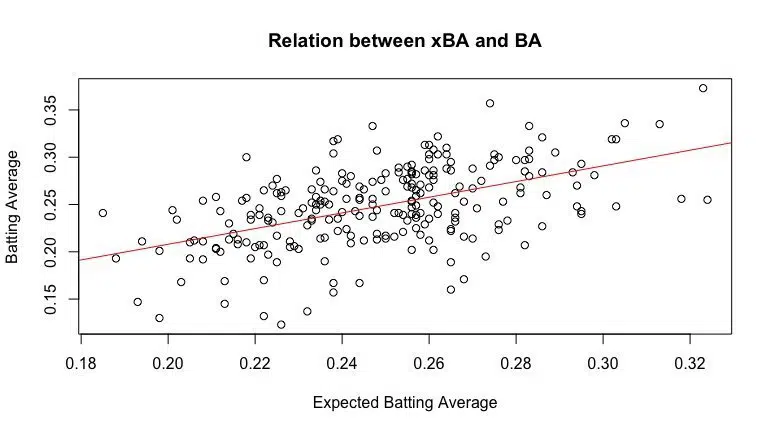
Now, you might be asking, is there any correlation between expected batting average and actual batting average on ground balls? Yes; 0.51 to be exact, which means there’s fairly strong position correlation (when xBA rises, so does BA). This is a point in Yoan Moncada’s favor: as he hits the ball harder, his expected batting average will rise. Naturally, if your expected batting average rises, there’s a larger percentage chance that your batting average rises too.
So, why use expected statistics rather than actual statistics? My rationale is this: baseball is a game of chances, luck, and probability. A player can hit a ball that has a 99% chance of being a hit, yet sometimes that 1% wins out, maybe by some crazy, diving catch. On the flip side, a ball that only has a 10% chance of being a hit can fall in for a single. However, I’d rather the player hit the ball like he did the first time every time, rather than the way he hit the ball the second time. Why? Because he has a much higher chance of getting more hits that way over the course of the season. In short, expected statistics take some of the randomness of baseball out of the equation. Expected statistics can be used to evaluate a player by what they can control.
This is where things get interesting. How did Moncada rank in terms of expected batting average on ground balls across the league? Well, he ranked second overall among those with at least 100 ground balls, just behind Andrew Benintendi (though it is not included, Moncada was also second in xwOBA, also just behind Benintendi).

There are some pretty notable names on that list, with an interesting case study at the very top. Andrew Benintendi notably had a pretty down season in 2019. Yet, it appears as if there was considerable bad luck that went along with this, as evidenced by the large negative split between his expected batting average and actual batting average. How much should Benintendi really change his game based on this? It’s a fascinating question and study on why just looking at a player’s actual statistics doesn’t show the full story of a player’s performance.
However, on the flip side, Yoan Moncada outperformed his expected batting average on ground balls by exactly 50 points. How was this compared to fly balls and line drives?
Fly Balls: .430 BA, .366 xBA (.476 BA, .385 xBA at Guaranteed Rate Field)
Line Drives: .640 BA, .636 xBA
The difference in xBA and BA isn’t as drastic for either of these, and I mostly blame the differential in fly ball batting average on playing in a hitter’s ballpark in a season with juiced baseballs. So, Moncada’s batting average on ground balls remains a critic’s strongest point of analysis for a Yoan Moncada to regress in 2020. Yet, at the same time, his .323 xBA and .289 xwOBA says that he still made some very high quality contact on ground balls.
Still, there’s a 50 point difference in batting average that we have to try and make up here, which we will get to in a little bit.
Launch Angle and Batting Average
If we are going to talk about Exit Velocity, we have to talk a bit about Launch Angle; these two things together are the basis for evaluating every single ball that comes off a player’s bat.
The angle at which the ball comes off a player’s bat is incredibly important when determining if a player will have a successful outcome on a ball in play. Typically, the “ideal” launch angle range is somewhere between 0 and 30 degrees. You might have seen a chart similar to this before, but here’s a graphic from Tom Tango (@tangotiger) that graphs wOBA as a function of launch angle:
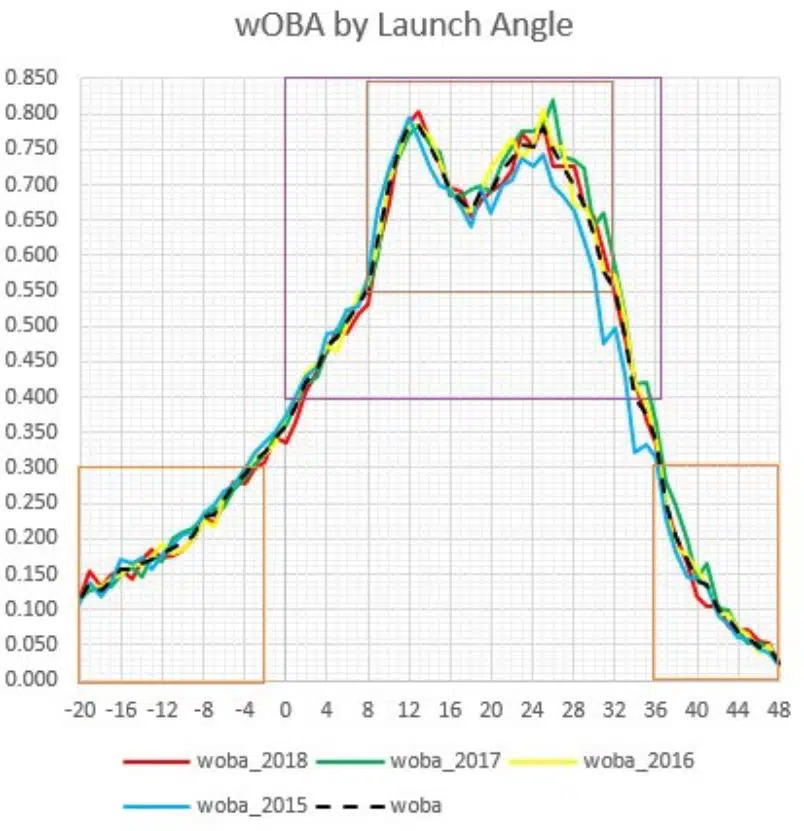
So, based on his research, Tango suggests that a player’s focus should be on maximizing the amount of balls they hit with a launch angle between 0 and 36 degrees – and even more specifically, 8 to 32 degrees – in order to maximize their production levels at the plate. The distribution here is what matters, not the average launch angle.
So, how often does Yoan Moncada hit balls within these ideal ranges? In 2019, 56% of Moncada’s at-bats resulted in a ball hit between 0 and 36 degrees, and 40% of his at-bats resulted in a ball hit between 8 and 32 degrees. Moncada’s wOBA/xwOBA in the 0-36 degree range was .741/.711 and .846/.800 in the 8-32 degree range.
These are really impressive numbers. For comparison, 57% of Mike Trout‘s at-bats resulted in a ball hit between that 0-36 degree range, while 56% of Cody Bellinger‘s at-bats resulted in a hit in that range (League average is around 50%, so Moncada is well above average). So, Moncada is well in line with some of the game’s best players in this regard. However, we would expect high amounts of production in the “ideal” range of launch angles. How did Moncada perform in the extremes of that graphic?
Launch Angle Less than 0 Degrees: .273 BA/.236 xBA; .256 wOBA/.211 xwOBA
Launch Angle Greater than 36 Degrees: .094 BA/.072 xBA; .132 wOBA/.100 xWOBA
There was some luck involved with balls hit above 36 degrees, but Moncada was 5-for-53 in these at-bats, and I really don’t think the “luck” here is anything of note. However, Moncada’s performance on balls hit with a launch angle less than 0 degrees is in line with what we talked about before: there was some luck involved with balls Moncada hit on the ground. Moncada’s .037 BA-xBA value was the 46th highest value among those players with at least 50 balls put in play with a launch angle less than 0 degrees. This is similar to players such as Jorge Alfaro, Cody Bellinger, Khris Davis, and Nelson Cruz. Additionally, Moncada’s .256 wOBA was the fifth-highest mark in the league, but at the same time, his xwOBA was also the seventh-highest mark in the league.
Let’s combine exit velocity and launch angle for a minute, still focusing on balls with a launch angle less than 0 degrees. Knowing what we know from before – that the average exit velocity on ground balls was around 85 mph – how did Moncada perform on balls hit at least 85 mph with a launch angle less than 0 degrees?
Launch Angle <0, Exit Velocity >85: .344 BA/.298 xBA; .328 wOBA/.263 xwOBA
Launch Angle <0, Exit Velocity <85: .147 BA/.119 xBA; .129 wOBA/.114 xWOBA
Alright, I’ve thrown a lot at you here. What does this all mean? It builds on a previous theme: there was some luck associated with Yoan Moncada’s performance in 2019 that is clear by the fact that his actual batting average is higher than his expected batting average, especially for ground balls. However, there is a sizable difference between being lucky, and being so lucky that a player’s abilities are called into question.
By looking at Moncada’s performance on balls hit in the ideal launch angle, it is clear that he not only performs well on balls he hits in the ideal launch angle range, but he also can do this as consistently as some of the best in the league. While Moncada also outperformed his expected statistics outside of the ideal launch angle range, he was also expected, based on statistics, to be among the best in the league (7th in xwOBA). Even if you isolate Yoan Moncada’s statistics, you would see that his expected statistics would’ve resulted in a pretty good season for Moncada.
Yet, I’m not yet ready to chalk up the entirety of these difference between actual and expected statistics to luck.
What A Lot of Analysis Misses
So, we’ve walked through exit velocity and launch angle, and there is still a lot of “luck” in Yoan Moncada’s performance that hasn’t been explained. But, here’s where the part about watching him play daily comes into play. It would be really easy for me to throw a bunch of variables into an equation and tell you what percentage of “luck” can be explained away by statistics. However, I think it might be a bit more fruitful to show you something a lot of equations can’t measure: the effect of shifting.
Because for everyone one of these types of hits…..
or maybe one of these…
there’s several ground outs like this one…
(Note: all three videos work. Just click the “Play” button in the center, even though there is no preview)
In just these three at-bats, Moncada likely should’ve been 1-for-3. Instead, he was 2-for-3.
What’s my point? There’s bound to be some “luck” involved once a team shifts on a hitter, because by taking away some percentage of hits, a team is naturally going to give up a new percentage of hits that were previously outs.
Here are Moncada’s statistics while shifted on and not shifted on in 2019:

In general, teams were successful when shifting against Moncada in 2019 – his wOBA is almost 100 points lower against the shift. However, at .352, his wOBA while facing the shift is still incredibly respectable and well above the league-average wOBA of .320. To further this, Yoan Moncada had 22 hits on ground balls he hit left-handed when the infield was shifted. 8 of them looked something like this….
Is that luck? Most people would have you believe it is, and so would the numbers, since I’m willing to bet the xBA on that ball was quite low. I’m not as convinced.
I believe that shifting plays an important – and not easily quantifiable – role on Yoan Moncada’s 2019 BABIP, especially when it comes to explaining some of the “luck” associated with that 50 point difference between Moncada’s BA and xBA on ground balls. Granted, this is not to say that the entirety of the difference between the two can be explained by shifts. However, this is certainly a place to start discussions, and in my opinion, is the area most people who talk about Yoan Moncada fail to discuss.
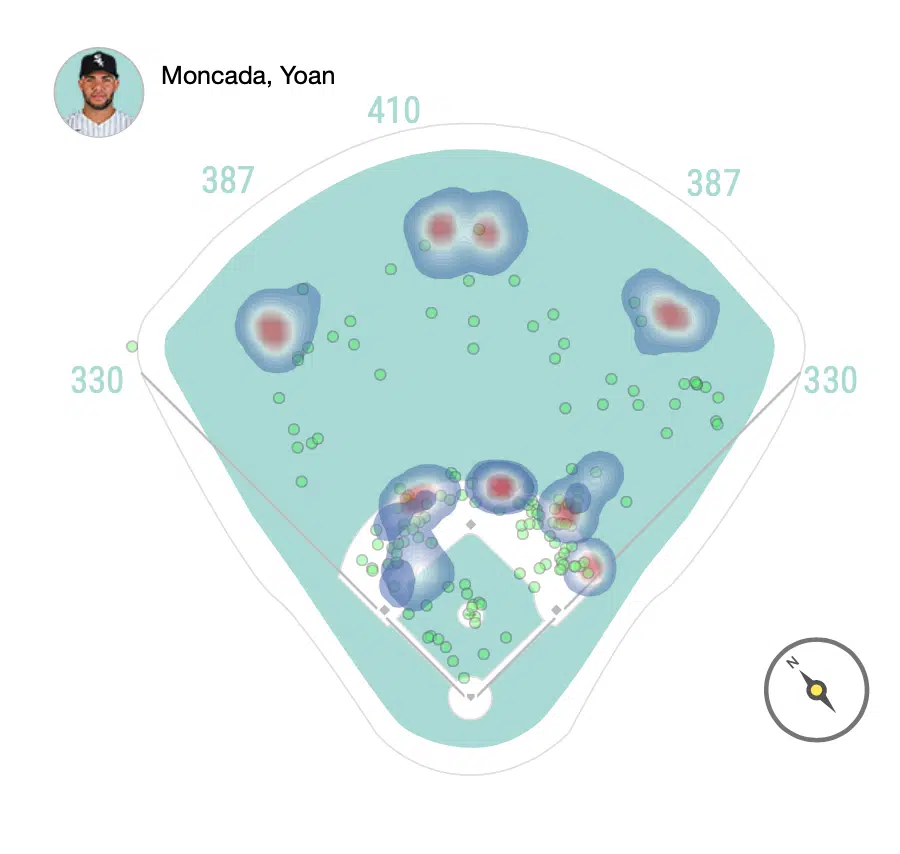
Knowing this information might lead to more teams shifting against Moncada in a higher percentage of his at-bats. If so, it will be up to Moncada to adjust. I will be curious to see how this graphic below shifts – if at all – after 2020 (yes, the “shift” pun was completely intended). Perhaps the second baseman will play deeper more often?
2019 Player Positioning vs. Moncada (LHB)
The Verdict
Is Yoan Moncada actually good? Yes. I’m not sure why this continues to be in doubt.
Is Yoan Moncada as good as or better than the likes of Kris Bryant, Cody Bellinger, or Francisco Lindor? No, and I would caution White Sox fans against using this type of rhetoric.
The reality is this: Yoan Moncada played very well in 2019. The metrics point out that, yes, in fact there was some element of luck to his success. While Moncada’s ability to drive the ball, his speed, and the effect of shifting are incredibly valid arguments, the differences in xBA and BA, along with his BABIP, cannot be completely statistically explained, leaving only an element of luck as an explanation. However, his expected metrics show that based solely on what Moncada can control, he would’ve had a very very good 2019, even if there wasn’t some amount of good luck on his side. His expected statistics still put him at the top of the league in facets of his game that have been deemed “lucky.”
Sure, Yoan Moncada should absolutely try and hit fewer balls on the ground – especially fastballs. I don’t LOVE the fact that he hit 43.4% of fastballs on the ground last year, compared to 34.6% of fastballs in 2018. However, there is nothing in the data that would suggest that Yoan Moncada does not have the ability, in his current state, to be a 4-5 win player in 2020; frankly, Moncada likely would’ve been a 4 win player without any luck last season. Additionally, to suggest Moncada needs to drastically overhaul his approach in 2020 to achieve a similarly successful season is unfounded, especially considering the fact that he just drastically overhauled his approach heading into 2019 with positive results.
Yoan Moncada has always been a high BABIP hitter. Here are his stats throughout the minor leagues as well.
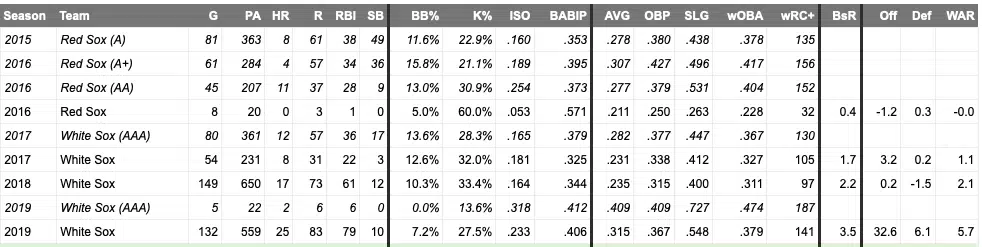
Now, please don’t take this as me advocating for the use of minor league statistics to back up major league performance. This, rather, is an illustration of Moncada’s high-BABIP career. Yes, .406 is an INCREDIBLY high BABIP – and, yes, as we’ve shown here, it is unsustainable. However, the idea that Moncada’s career will be one filled with high BABIP seasons certainly has some validity.
Some may worry about how far Moncada’s production may fall when some of his luck runs out. To answer that question, the best thing that can be done is to look at a player’s expected statistics. Moncada’s .291 xBA, .524 xSLG, and .362 xwOBA (.315 BA, .548 SLG, .380 wOBA) don’t match the level of production from 2019, but they don’t show as drastic of a drop off as some analysts might lead you to believe – or might want to believe themselves. This is what I’ve tried to show throughout this analysis.
Let’s not forget one final factor too, one factor analysts can’t predict yet: Yoan Moncada and the White Sox staff see the same data as every one of us armchair analysts. Anything I’ve mentioned in this article – or anything any analyst has mentioned in any article – has likely already been identified, discussed, and dissected by the organization. To assume Yoan Moncada cannot repeat his performance would be to assume he makes no adjustments from season to season, and this is not an assumption I think any analyst should be comfortable making.
So, the next time someone tries to bring up Moncada’s BABIP or talk about his luck on ground balls, I challenge all of you to be fans who don’t get mad or angry. Rather, challenge others to look at Moncada’s expected statistics. In there lies the best answer we have for how Moncada could perform in 2020. Plus, I’d LOVE to hear the reactions you get from that answer.
Because Moncada has only played two full seasons, it’s still premature to make any comment on the type of player he truly is yet. To compare him to some of the greats of the game today would be unfair to him, as his sophomore season has just been completed. However, let the haters hate. From what I’ve seen, Yoan Moncada is a good baseball player, and he’s here to stay.
I look forward to seeing just how good he might be.
Questions? Comments? Thoughts/Opinions? Let me know below or on Twitter! @jlazowski14
Featured Photo: FotoGenocide (@FotoGenocide_)
Wow, what a phenomenal article…well done!
Thank you so much, I really appreciate it!