I finished up finals about two weeks ago. Like every other college student, I was sleep-deprived and overcaffeinated completing my projects and studying for exams. In my business analytics class, I was tasked with finding/creating a database and doing an analysis on it. Of course, my mind immediately went to baseball and the White Sox. How fun to write about baseball for a final, right? Wrong. This project consumed me and I spent way too long writing this instead of studying. It was worth it.
I wanted to look into:
- How ground ball rate, exit velocity, and walk rate affect winning percentage
- Which of those three statistics was the best at predicting winning percentage
- Why the 2021 White Sox offense was so great, based on these statistics
I am only looking at these three hitting statistics and will not be investigating pitching statistics and their correlation to wins. Here is what I found.
(Editor’s Note: If you are having trouble viewing any of the following graphics, click on the link below each graphic)
GB% and Win%
First off, GB% has a high correlation with wins from 2018-2021; notably, the higher a team’s ground ball rate, the lower their winning percentage. Here are some regression equations and a graph of 2021 GB% and Win% to explain that.
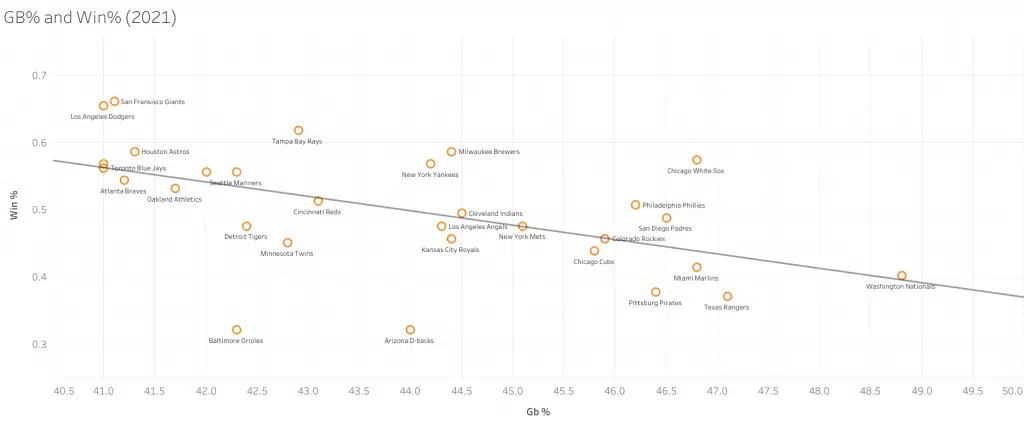
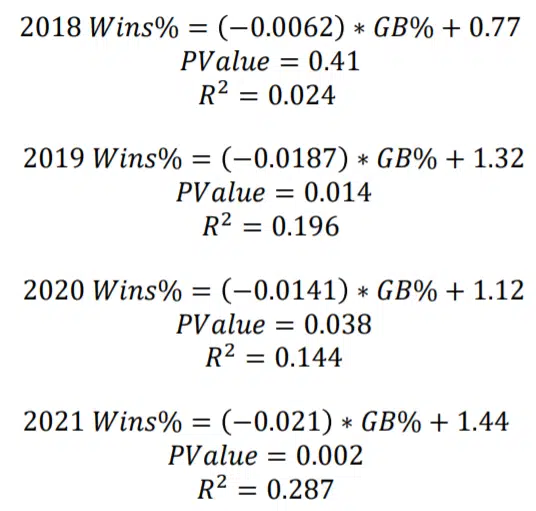
If you haven’t seen this stuff since your last stats class, that’s okay. All you have to know is that as the R^2 value increases, there is more of a correlation between Win% and GB%. This also means, in 2021, if GB% increased by 1%, Winning Percentage would drop by 0.021 percentage points. This doesn’t seem like much, but if you compare the teams with the highest ground balls rates with the lowest ground ball rates, the difference in projected wins could be as high as 25 additional wins with fewer ground balls.
The reason for the increase in correlation is due to the increase of shifting in MLB and the rise of home runs. MLB teams are shifting more every year resulting in balls hit on the ground leading to outs more than ever.
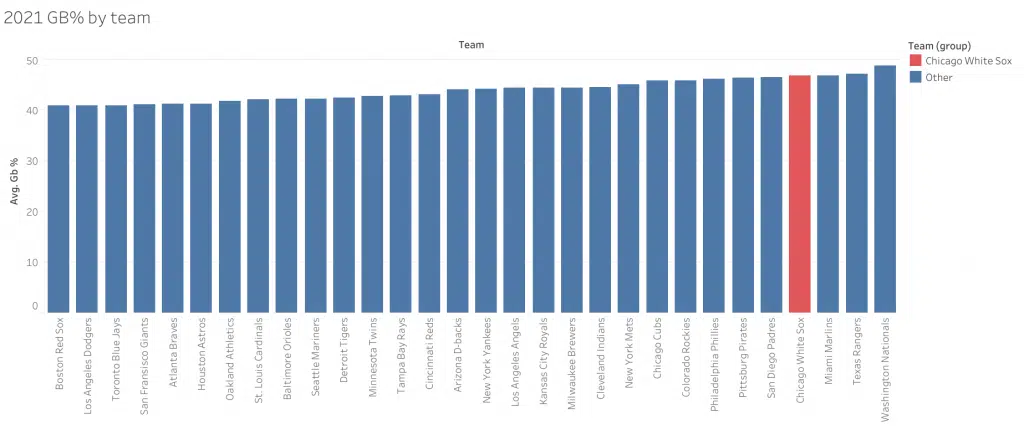
Four of the five teams with the lowest ground ball rate made the playoffs and one of those teams (Atlanta Braves) went on to win a world series. As you can tell from the previous two graphics, however, the White Sox are very much outliers though. The White Sox ground at more than any other playoff team. So how did they make this work? How did they win so many games by hitting so many ground balls?
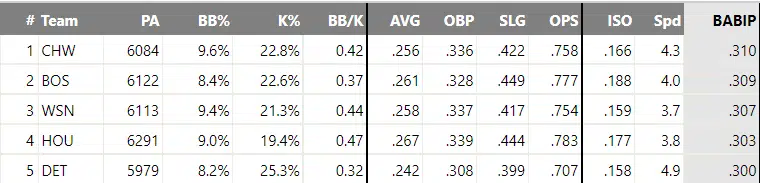
These are the BABIP leaders in 2021. The White Sox were the number one team in this. BABIP measures the batting average of a ball hit into play. Basically, it’s batting average minus strikeouts and home runs. So, this means when the White Sox hit the ball onto the field it landed for a hit more than any other team in the league.
This requires a bit of luck and explains that when the White Sox hit the ball on the ground, it rolled out of the infield and into the outfield for a hit. For most teams in the league, these types of hits resulted in ground-outs. So, why are the White Sox different? This means the White Sox must have been hitting the ball really hard and that’s why the ground balls lead to hits, right?
Exit Velocity and Wins
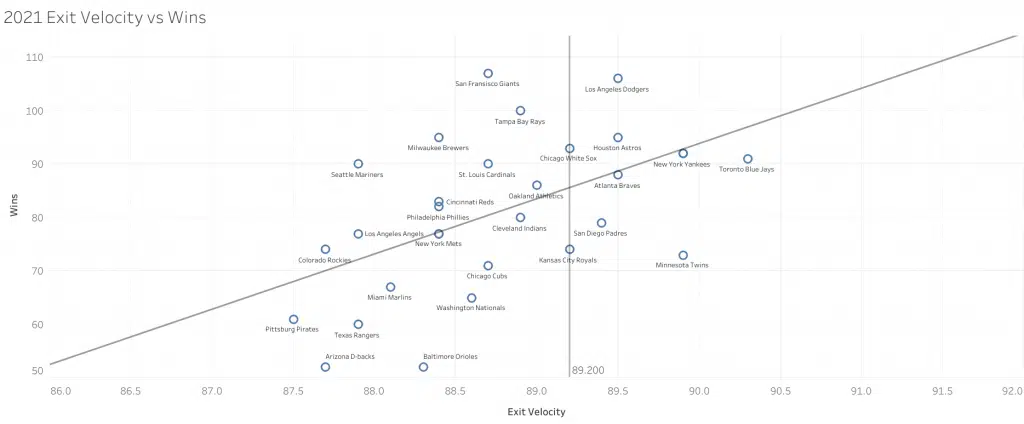
This is a graph of Exit Velocity vs. Wins in 2021. I added a trendline to show that if you hit the ball harder you win more games. I also added a verticle line where the White Sox sit in terms of average exit velocity. We can see that the White Sox were tied in 8th for exit velocity., which makes sense. However, at the time time, we can see that the Royals had the same exact exit velocity as the Southsiders, yet they had 19 fewer wins.
Why is that? The must be a significant difference in plate approach that caused the White Sox to be so much better than the Royals.
BB% and Win%
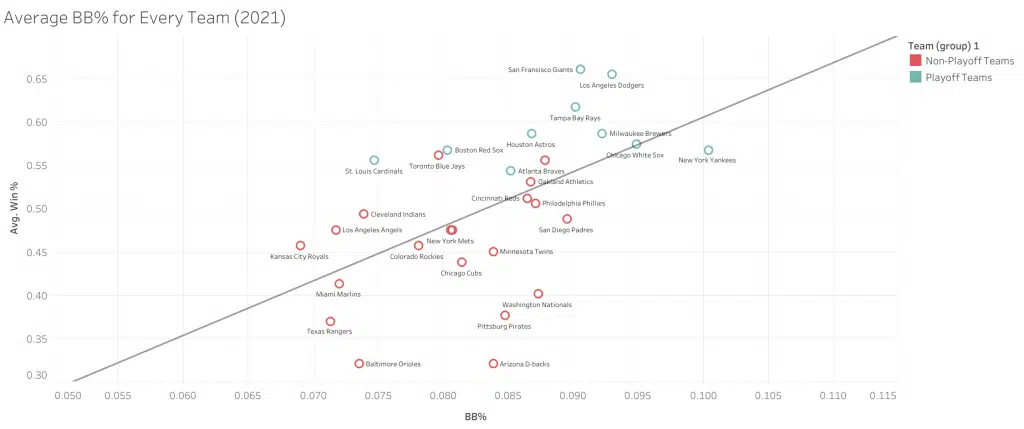
I highlighted all the teams that made the playoffs in green and the rest in red. Now, this is starting to make more sense. The White Sox were ranked second in BB%, while the Royals were last. The White Sox had a much better plate approach than the Royals even though they hit the ball just as hard. Nice!
Now we have three statistics that somewhat correlate to wins. Which one is the best though? Here are the correlations for GB%, Exit Velocity, and BB% in comparison to Wins.
Conclusion
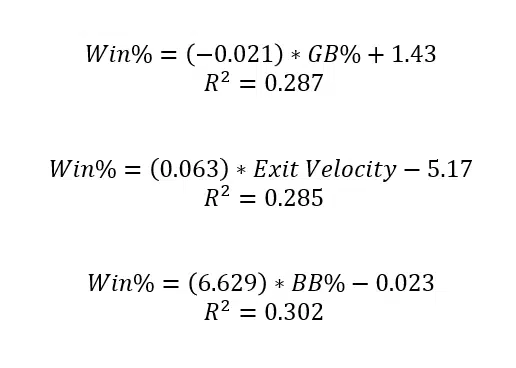
So, looking at the equations we can see that BB% has the highest R^2 value. This means that a team’s walk rate correlates the most with Win % and is the best of these three hitting statistics to determine wins.
This is the reason the White Sox offense was so good in 2021. While the team hit the ball relatively hard, they did ground out a lot, yet were very patient at the plate. They walked a lot, got on base a lot, and for that reason, the White Sox won a lot last year. Getting on base creates more opportunities to score runs when players are struggling at the plate.
The reason I’m talking about this is to emphasize the importance of players like Yasmani Grandal and Yoan Moncada. I see a lot of disagreement on Twitter towards these two players. These two players had their fair share of ground ball outs and low exit velocity outs, but they both were one and two, respectfully, on the team in walk rate (min. 250 plate appearances). Grandal led Major League Baseball in walk rate and Moncada was 19th in MLB. These two players helped the White Sox win a lot of games in 2021 and are both above-average batters who should receive more respect for their skills.
So, as Jordan Lazowski always says, Why do we like Yaz? Why do we like Yoan?

Featured Image: White Sox / Twitter
Nice work, Tommy…it will be interesting to see if the Sox can maintain their high BABIP average this year. If not, we may see a dip in their win total. Hopefully, Hahn will be adding players with high OBPs and more plate discipline to the lineup.
Thank you! I assume our BABIP will probably still be high next year because of guys like Robert and Anderson, but it will be interesting to see the numbers next year. I’m hoping Hahn adds some high OBP guys regardless just because more plate discipline never hurts.
“finishing up finals under stress”, god i miss being an undergrad, working on my dissertation feels like finals every day but for 5 years straight, i wouldn’t wish this on anyone, and glad that anyone that deals with stress appreciates what they’re able to accomplish like this article. Anywho, i love data and i LOVE this article. It was also simple to follow for most people getting into the data of baseball. Please keep these coming!
The advantage of hitting after Grandal on Moncada is if they walk with 1 out or less you will prolly get a pitch you can hit in the first couple pitchrs.
Yes, that’s true. The patience of both these players makes pitchers have to pitch to them and Grandal made those pitchers regret doing that a lot last year.